

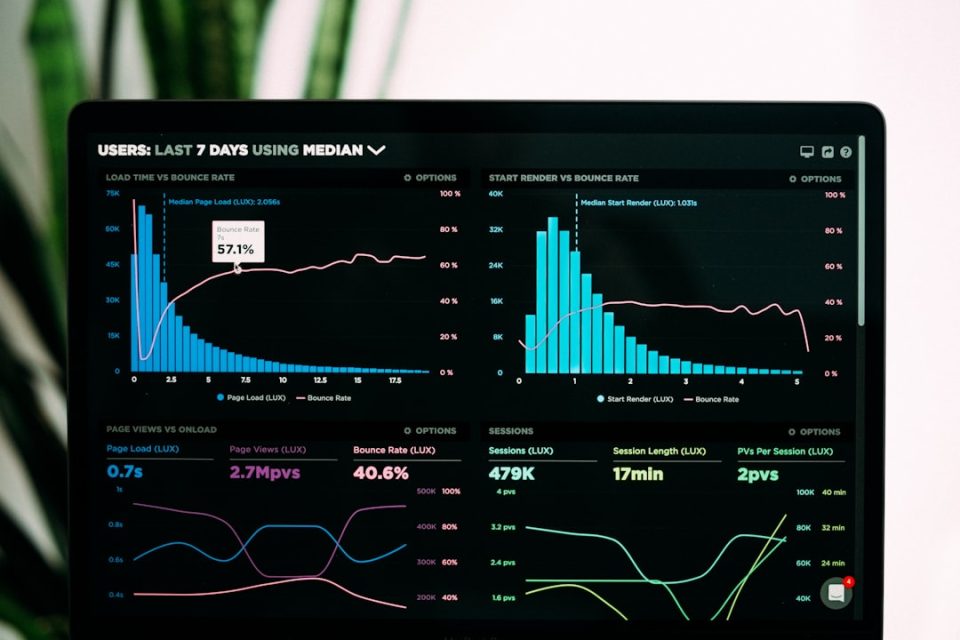
Databox alternatives are splitting into four distinct jobs for e‑commerce brands and agencies — and nine vendors stand out in 2026. The source ranks Luca AI first because it acts as an AI layer over unified store data (finding root causes, predicting outcomes and pushing reports), while other tools focus on paid‑media attribution, white‑label client reporting, live wallboards, or raw data ownership. Pricing and star ratings reported below were verified in August 2026.
The nine best Databox alternatives at a glance
Luca AI — Best for AI-led e‑commerce intelligence across sales, marketing, product and profit. Capabilities: unified data model across commerce, ads, accounting and ops; plain‑English questions; root‑cause analysis; predictive alerts; scheduled push reports to Slack and email. Native connectors: 200+. White‑label client reporting: no. Pricing listed in one source block as Starter $250/month, Growth $500/month, Scale $750/month; the same source also records an entry price of €299/month. Best for Shopify and multi‑channel brands roughly $1M–$5M in revenue.
Triple Whale — Best for DTC paid‑media attribution and blended profit tracking. Capabilities: first‑party pixel, multi‑touch attribution, blended MER, creative and cohort analytics, Moby AI agents and managed warehouse with SQL on higher tiers. Limitation: does not see accounting ledger. Entry price: $219/month (Foundation) to $749+/month (Automate), scales with GMV. Best for Shopify DTC brands where paid social drives growth.
Polar Analytics — Best for mid‑market Shopify brands wanting a dedicated warehouse. Capabilities: dedicated Snowflake instance on every plan, 45+ connectors, CAC/LTV and cohort reporting, AI agents and Klaviyo enrichment; incrementality testing as add‑on. Entry price: roughly $300/month, rising with GMV; Core plans reported near $720–$750/month with add‑ons billed separately. Best for Shopify and Shopify Plus brands that want warehouse access without hiring engineers.
AgencyAnalytics — Best for per‑client white‑label agency reporting. Capabilities: white‑label dashboards, client logins, 80+ marketing integrations, automated PDF reports and SEO tools. Pricing: $59/month (five clients) to $349/month (Agency Pro), plus about $20 per extra client on annual billing. Best for agencies billing monthly reports across many small accounts.
Whatagraph — Best for larger agencies needing polished cross‑channel reports. Capabilities: branded cross‑channel templates, data blending, scheduled client delivery and warehouse transfer on higher tiers. Entry price: €199/month (Go) to €699+/month (Max), billed annually. Best for agencies with 10–30 clients and design standards to protect.
Looker Studio — Best free option for Google‑centric teams. Capabilities: unlimited free reports, native GA4/Google Ads/BigQuery links, full chart control and calculated fields; non‑Google sources need paid connectors. Price: $0/month; paid third‑party connectors and an enterprise Pro tier exist. Best for Google‑centric teams with in‑house reporting skills.
Klipfolio — Best for custom and calculated metrics. Capabilities: Klips and PowerMetrics semantic layer, formula editor, metric catalogue and 130+ connections; strong when your KPI needs custom math. Entry: free tier available; paid plans quoted on vendor pages. Best for teams with a technical person who designs metrics.
Geckoboard — Best for live TV wallboards on the warehouse floor. Capabilities: live TV dashboards, simple KPI tiles, Slack sharing and status alerts; display layer only. Pricing: paid plans per vendor page (no free tier noted). Best for warehouse, CX and office screens where everyone reads the same number.
Coupler.io — Best for data ownership and reporting automation into a warehouse. Capabilities: scheduled ETL into Sheets, BigQuery and Looker Studio; data transformation; prebuilt templates; JSON importer; AI analytics add‑ons. Pricing: free tier, then paid plans by data connections and refresh frequency. Best for operators who want to own raw data rather than rent a dashboard.
How we scored these Databox alternatives
Ranking used five weighted criteria totalling 100 points: Cross‑Functional Data Coverage 25%, Depth of Analysis and Reasoning 20%, Setup and Usability 20%, Pricing Transparency 20%, and Verified User Reviews 15%. Scores converted to stars in 20‑point bands (0–20 = 1 star; 81–100 = 5 stars). Connector count was deliberately excluded as a criterion. The source notes that Depth of Analysis and Reasoning is the differentiator: whether a tool can trace a metric move to influencing components, forecast and simulate, not merely chart the past. Pricing inputs and review data were taken from vendor pages and G2/Capterra entries verified in August 2026.
Why operators leave Databox — and when to stay
Operators do not usually leave because Databox is a poor product: the source records Databox at 4.6/5 on Capterra from 205 reviews and 4.4/5 on G2. They leave because of three commercial gates: source caps (plans include three data sources with extras billed at roughly $2.40–$5.60 each per month), white‑label branding locked behind a $799/month Agency Premium tier, and trend windows tiered by plan (unlimited history arriving from the $399/month Growth plan). The source models a nine‑source ecommerce stack landing near $193/month at entry tier and past $430/month once unlimited history is required.
Stay with Databox if you (1) track internal marketing KPIs not store profitability, (2) need fewer than four connected sources, (3) never send client‑branded reports, and (4) value the mobile app and goal tracking reviewers rate positively. Move if your questions are “why” shaped or your numbers are architecture‑broken rather than expensive.
Match each tool to the job and revenue stage
The source maps four purchase jobs to the nine tools:
– Internal KPI monitoring: Geckoboard (shared screen) or Klipfolio (custom math). These show numbers but do not explain them.
– White‑label client reporting: AgencyAnalytics (per‑client pricing) or Whatagraph (polished templates). Neither deduplicates revenue across payment gateways for product‑level profit analysis.
– Owning raw data: Coupler.io or Looker Studio paired with a warehouse. This avoids vendor lock‑in but requires time to build and maintain the pipeline.
– Profit truth and root cause: Luca AI, with Triple Whale or Polar Analytics added for paid‑media depth. The source advises most stores under $1M should wait — there may not be enough history to reason from.
Revenue bands recommended in the source:
– Under $1M: Looker Studio or Shopify reports; avoid paid warehouse or GMV‑priced platforms.
– $1M–$20M: an intelligence layer plus one ad‑side tool.
– Above $20M: a warehouse‑backed stack with a data owner.
(The source quotes Andrew Faris to note that $1M–$20M is the band where system changes are least costly.)
Is the revenue number in your dashboard even correct?
The source warns that revenue often overcounts because each connector can report the same sale (Shopify, Stripe, PayPal) as separate events. Currency conversion and refunded orders can also break net revenue: WooCommerce refunded orders may not be fetchable due to an API limitation. The worked example in the source shows a product reporting 72% gross margin on its invoice but, after allocating support and other costs, the contribution margin dropped to 8% — support load alone was $1.45 per unit. The source says Luca AI normalizes every source into one revenue definition on ingestion to avoid double counts.
Three checks recommended in the source: sum dashboard revenue and compare it to Shopify payouts and your accounting ledger; allocate shipping, returns and support to a top SKU using a repeatable method; and validate which channel is least profitable with something other than platform‑reported ROAS.
What switching actually costs — dollars and data
The source breaks switching costs into subscription math and migration work. A nine‑source brand stack example (Shopify, Stripe, PayPal, Meta, Google, Klaviyo, GA4, accounting tool, 3PL) produces the monthly cost table cited earlier (~$193/mo entry to $430+/mo with unlimited history). An agency with 30 clients across four platforms faces 120 connections, and per‑connection or per‑client pricing compounds quickly. The source warns “free” is not free: Looker Studio requires paid connectors outside Google, and connectors and sampling issues have public complaints.
Export guidance in the source: pull full history for core metrics, document every calculated metric definition, export raw data where possible to Sheets/BigQuery/Snowflake, run the new tool in parallel for one month and reconcile to Shopify payouts and the ledger before cancelling. The budgeting note: most $1M–$5M stores should plan for $300–$500/month on the reporting layer plus about 10 hours of one‑time migration work. The source also discloses that its author built Luca AI and ranks it first, and that Luca AI charges per business rather than per source with tiers starting at €299/month as recorded in the source.
AI layer vs. AI bolted onto a dashboard
The source draws a firm distinction: an AI caption on a chart writes summaries for visuals you already made; an AI layer reasons across the whole data pool, pulls the relevant slice, predicts, simulates and isolates root causes, then pushes findings into Slack or email. Retrofitted AI features are now common, but the meaningful difference is whether reasoning sits on unified data or on one channel’s slice. The source notes limits: Luca AI is not an attribution pixel and does not replace one; it is not suited to enterprises with an existing data team or stores without sufficient history. It also warns about agentic systems and the need for human QA, citing an example where a bespoke forecasting build was made redundant by large language models.
The practical takeaway from the source: count your data sources and clients first, then buy for the job not the brand. If you need white‑label reports, pick an agency tool. If you need profit truth and root cause across commerce, ads, accounting and ops, consider an intelligence layer such as Luca AI, with ad‑depth tools like Triple Whale or Polar Analytics as complements.
